7 Cool Statistics From Navy’s Football Season You Didn’t Know
By now, Navy fans know that going from 3-10 in 2018 to 11-2 in 2019 represented the second biggest turnaround in FBS history. And in my very first post on the Navy Football team last January, I discussed three key inflection points that led to their successful season. Check it out if you haven’t already. So in this post, I got a little bit more into the numbers and identified seven cool statistics from the past season that got my attention. Some are individual statistics, but they all tie back to the team and how hard these guys play for each other. That’s what defines the Navy Brotherhood. So let’s use the countdown approach for this. Here we go!
Cool Statistic #7: A Unique Passing Day
The word “unique” means “no more than one” or “being one of its kind.” After watching last year’s Army-Navy game and reading over the team passing statistics, that word came back to mind. Here are the numbers for the game: Pass Attempts – 1, Pass Completions – 1, Passing Yards – 1, Touchdowns – 1. Of course, that was the Navy Special play; the option pass from Chance Warren to Jamale Carothers. It gave the Mids a 14-7 lead and they rolled to a 31-7 win. When I saw the stat line, I thought, “that has to be a first for the program.” Then I began wondering if it had ever occurred before in all of Division 1 Football.
Let’s think about that for a minute. A team passes one time the entire game. And they complete that pass from the one yard line for a touchdown. That’s it. They don’t throw the ball the rest of the game. To me, that’s good enough to get it on the cool statistics list.
This has to be a potentially unique situation: 1/1 for 1 yard, and 1 Touchdown. I don’t have the Elias Sports Bureau at my disposal. But I would love to get them researching this particular statistic because I’ve got a pretty good feeling that the only time it’s ever happened was in the 2019 Army-Navy game. That’s as unique as a statistic can get, in every sense of the word.
Cool Statistic #6: Money in the Red Zone
Few things measure an offense’s efficiency better than performance in the red zone. It’s even more critical that they take full advantage of the opportunity by scoring touchdowns as opposed to field goals. In 2019, Navy showed their ability to close the deal consistently in that department. The offense made 49 trips to the red zone and scored 47 times. That worked out to a 95.9% conversion rate: good for third in the nation behind Kansas State (96.2%) and LSU (96%).
And when it came to scoring touchdowns, the Mids were the best on a percentage basis. That’s why this makes the cool statistics list. The Navy offense got into the end zone 79.5% of the time compared to 78.6% for the Tigers. Yeah, I know LSU scored 10 more touchdowns on more opportunities. But how cool is it to say that Navy was just a little more efficient at getting across the goal line in 2019 than the team that won the national championship?
Cool Statistic #5: Not Just Better . . . Way Better
Navy led the nation in rushing last season with an average of 360.5 yards per game. That’s not first time they’ve done that. But in 2019, that offensive line was so incredibly dominant that the Mids rushing average was a staggering 62 yards per game better than the team that finished second (Air Force). I thought that was a pretty big number. And it got me to thinking if any other team had separated themselves from the rest of the pack by that wide a margin.
So I went to ESPN’s archive of college football statistics. You can access the previous rolling 16 years worth of numbers. I looked up the top ranked rushing teams for every season going back to 2004. It turns out that no team finishing first had a differential better than the 62 yards the Mids registered last year. In fact, no team got within eight yards of it.
So the yards per game differential was what helped qualify the rushing yards per game for the cool statistics list. The next closest was when Army posted a 53.6 yard differential over 2nd place Air Force in 2012. Not bad, but that superiority didn’t translate into wins because Army just wasn’t efficient in the red zone. They did most of their damage between the 20s. Those yards are basically meaningless if an offense can’t finish. And as you saw in the previous statistic, Navy’s conversion rate was pretty impressive.
Cool Statistic #4: Ridiculous Single Game Rushing Averages
One indicator of a player having a good day running the ball is the average yards per carry. If that number is above five with an average of 12-15 carries per game, that’s a very solid day’s work. Any number higher than five is a bonus. It tells you that the player running the ball has some skills, and that his offensive line is definitely getting the job done.
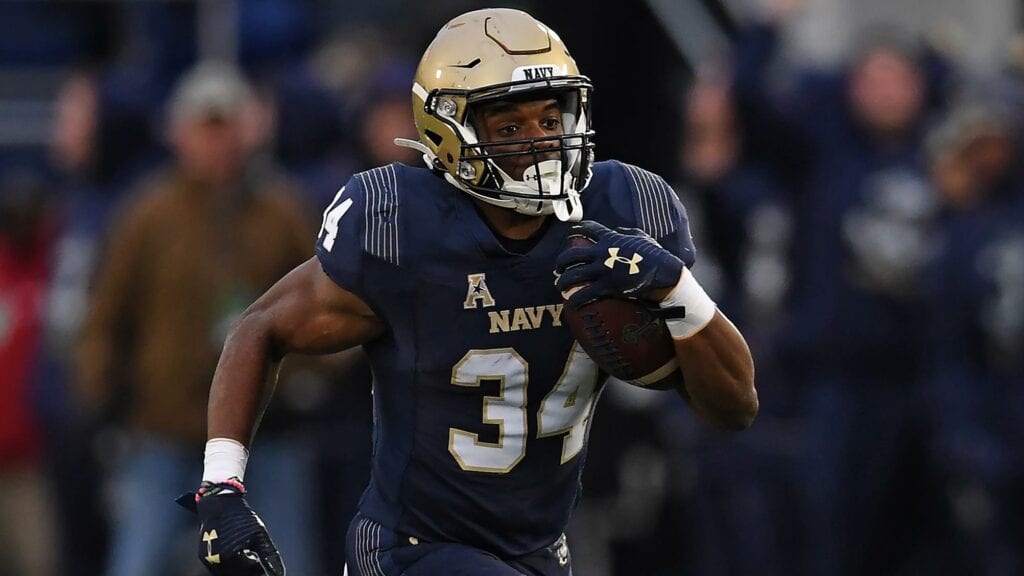
In 2019, Navy had a player average over 10 yards per carry (on at least 15 carries) during a game not once, but twice. Against Houston, the offensive line ran their trap play to perfection, and Jamale Carothers went crazy. He reeled off 188 yards on 18 carries (10.4 yds/carry). He also scored five touchdowns, and the Mids equaled their highest point total of the year in a 56-41 win.
Of course, Malcolm Perry was the second player to average over 10 yards per carry in the Army game. He ran for 304 yards on 29 carries (10.5 yds/carry). Here’s what was most remarkable to me though. Perry looked just as fresh on his final run (a 15 yard touchdown) as he did at the start of the game. His 304 total yards broke the record set by Eddie Meyers that had stood for 41 years (the first Army-Navy game I watched). The yards per carry easily comes in fourth on our cool statistics list. When your offensive line is dominating at the point of attack to where one of your ball carriers is averaging a first down every time he gets his hands on the ball, it’s going to be a good day.
Cool Statistic #3: Things Aren’t Always as They Seem
Here are Navy’s time of possession numbers from five games last season: 38:39, 27:51, 27:07, 36:00, and 29:26. Their record in those games was 3-2. Now, we all know that ball control is one of the key advantages of the triple option. So when looking at the time of possession in these games, you’d figure that the Mids easily won games one and four. They had the ball at least 60% of the time. And it’s likely that they dropped games two and three since they came up noticeably short in time of possession. Finally, the difference in games five was less than a minute, so you could pretty much call the TOP battle even, with Navy getting the win.
You would be correct in that last instance. Navy beat Houston in a game where the time of possession was basically a push. But in the first two cases, you couldn’t have been more wrong.
Wait . . . what? That means the Mids got beat in the two games last season where they held the ball about as long as they did the whole year (Memphis & Notre Dame). And they won the other two games where they had the ball their fewest number of minutes. That totally flies in the face of everything we come to know about time of possession. And what that tells you is that at least in 2019, that number was not as relevant because of the explosive nature of Navy’s offense. So time of possession became the third of our cool statistics for the exact opposite reason that you might think. With Malcolm Perry running the triple option and that awesome offensive line, the Mids could score from just about anywhere on the field.
Cool Statistic #2: Starting and Finishing Strong
This next statistic looks at points scored and allowed in each quarter for the whole season. In 2018, the Navy offense never scored more than 97 points in a quarter. And their opponents outscored them in each one by as many as 48 points. For the season, the Mids found themselves on the wrong end of a 111 point differential.
In 2019, it was a completely different story. The offense never scored fewer than 94 points in a quarter. The defense held their opponents to 75 points or less in every quarter except the second (101 points). But most impressive was the way in which the team started and finished the game. In both the 1st and 4th quarters, the point differential was the highest at 55 points. So it’s the consistency that puts this one at #2 on the cool statistics list. It speaks to how prepared the offense and defense were every time they took the field. In most cases, they got on top early and then left no doubt by finishing the game strong. By the end of the season they, had outscored their opponents by a whopping 193 points. It was a tremendous turnaround and a great team accomplishment.
Cool Statistic #1: Saving the Best for Last
This statistic definitely showcases Navy’s outstanding play on both sides of the ball in 2019. And it happened in back to back games at the very end of the season. What a way to cap off the year.
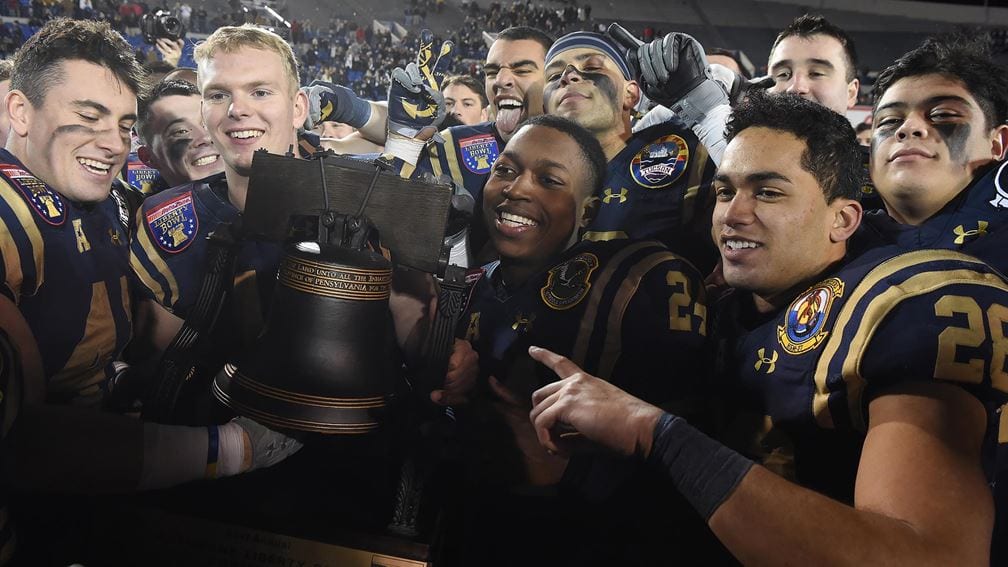
In the Army, game, the Black Knights drove 78 yards in 18 plays to score a touchdown in the 1st quarter. They never sniffed the end zone again after that. The Navy defense completely shut them down, allowing only 70 yards for the rest of the game, or 148 total yards.
Meanwhile, the Navy offensive line was so dominant that Malcolm Perry ran for 304 yards. Put another way, thanks to the offensive line, Perry ran for over twice as many yards as Army entire offense generated for the whole game.
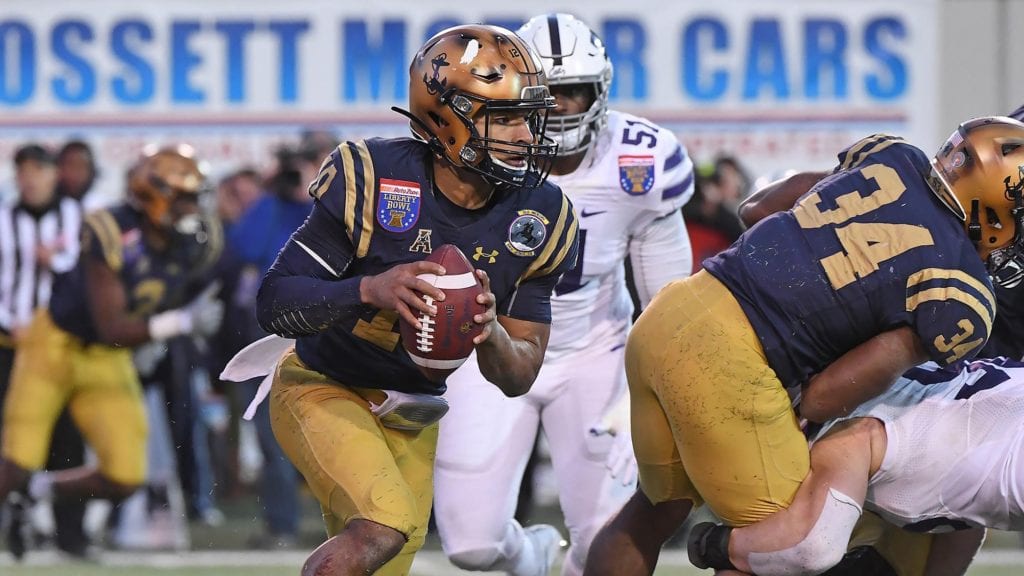
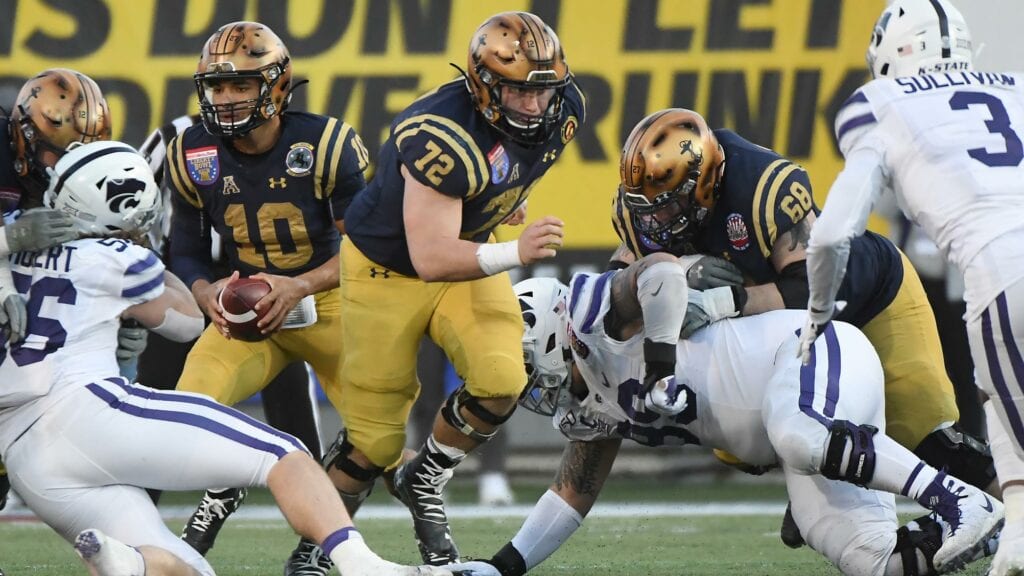
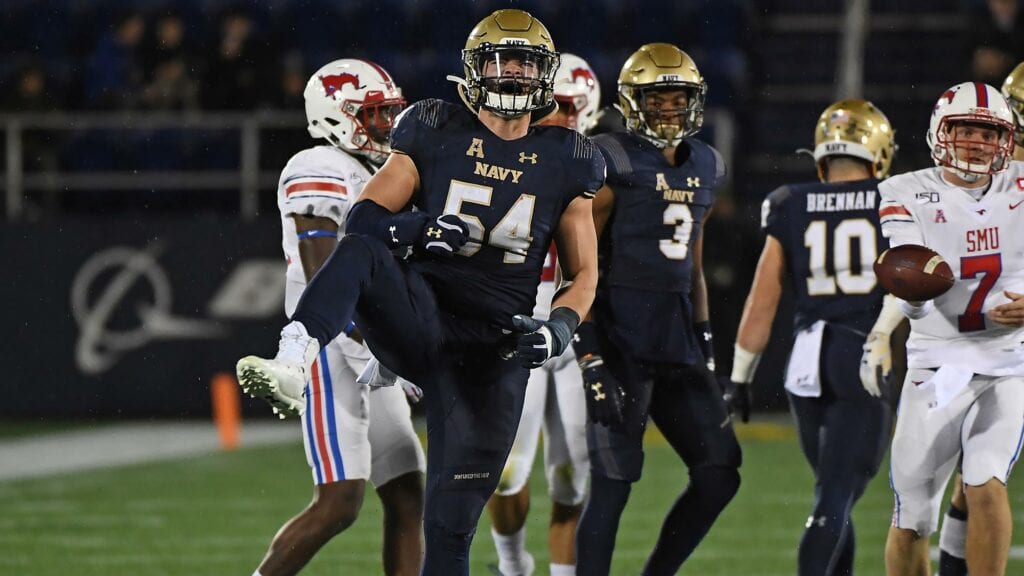
A little over two weeks later, the team pulled off the same feat in the Liberty Bowl. And it was against an outstanding Kansas State team. The Wildcats averaged about 360 yards of total offense per game. But the Navy defense totally confounded their quarterback Skylar Thompson. He threw for only 124 yards and the K-State rushing attack could only muster 46 yards. That put them at 170 yards for the game; less than half of their usual output.
On the other side of the ball, the Mids were happy to grind it out. They had the ball for over 36 minutes and the offense line was in control the whole game. Perry ran for 213 yards, averaging over 7.5 yards per carry. So, he accounted for 43 more yards than Kansas State’s offense. I sure would like to know the last time anyone did that for two games in a row. This was one of the most cool statistics I’ve ever come across.
And Perry clearly saved his best for last. He finished the year with 2,017 rushing yards. He got 517 of them (25.6%) in his last two games. That’s what I call going out in style.
Aren’t Numbers Fun?
I’ve always gotten a kick out of seeing how certain statistics figure into a game’s outcome. I’d say that things like fewer turnovers and better time of possession do predict the winner most of the time. And in Navy’s case, you could say that was true virtually all of the time up until this year. But clearly, the 2019 team threw convention out the window, with very positive results. They had the ball for less time that their opponent three times all year and won each game. And in a game where the time of possession was pretty close to even against South Florida (30:50 for the Mids vs. 29:10 for the Bulls) they had two more turnovers. Still the team totally worked USF, winning 35-3 on the road. That pretty much told me that this was a really special team.
Final Thoughts
On July 5th, the Navy players returned to Annapolis to prepare for what has already been a disrupted season. The Notre Dame game was moved from Dublin, Ireland to Annapolis due to the COVID19 pandemic. That’s not necessarily bad news for Navy fans, but there is still no word on how many will be permitted to attend.
Then last week, the Mids’ FCS opponent, Lafayette College announced that they were canceling their game with Navy because they wouldn’t have enough time to prepare. As of now, that Sept. 12th date remains open.
I have absolutely no idea what this season is going to look like. The optimist in me believes that we will have football in some form. I believe that Navy has an excellent protocol in place for bringing the team back. You can check for yourself by reading Bill Wagner’s article that was in the Annapolis Capital Gazette a couple weeks ago. I think they are doing everything they can to minimize the risk as much as possible.
So let’s hope some of these other teams can get their acts together and do a better job of safeguarding the players. That goes for the other fall sports also. I just don’t want to see the season get derailed before it even starts. With some good planning and maybe even a little luck, we will all be enjoying college football on some level in 2020. And then I can start my search for the latest cool statistics relating to this year’s team.
Until next time . . .
** If you enjoy the content you are reading on the Navy Sports Nation blog, spread the word! Use the Facebook and Twitter buttons below to share with your social networks. Thanks for your support! Go Navy!! Beat Army!! **
Thank you Navy Sports!

My sincere thanks to Scott Strasemeier, Senior Associate AD for Sports Information at the U.S. Naval Academy for granting permission to use images and video from the Navy Athletics media library. All photos used from this source will be properly credited in the caption. The only exception would be if the photo is used as a feature image where no caption is visible.
Follow Us
Share this story!
Related Links

Shop for Merchandise
Featured Products
As an affiliate partner, Fanatics shares a small percentage of each sale through these links with the Navy Sports Nation which will be used to maintain the website. Thanks for your support!
Did you know…
Navy and St.Mary’s are the only two rugby programs in the country that have produced two Rudy Scholz Award winners. The award for the collegiate rugby player of the year was first given out in 2016.
Connor McNerney was the Naval Academy’s first recipient in 2018. This year, Lewis Gray earned that honor. It was a fitting end to his outstanding career.
Favorite Books
Click on the images to buy these two “must have” books for all Navy football fans. As an Amazon associate, I earn from qualifying purchases.
cRA Div. 1 National Championship Highlights
Karl Darden
I am a Navy veteran and a graduate of the U.S. Naval Academy. The idea to start this blog actually came from my classmates. I hope you enjoy reading this content as much as I enjoy writing it. Go Navy!! Beat Army!!